Majorbird MES · Dashboards
See the line as it runs.
The data the floor captures becomes a live picture of production: yield, throughput, station status and unit history updating as operators work, on any screen from a supervisor's desk to a big board over the line.
Book a demo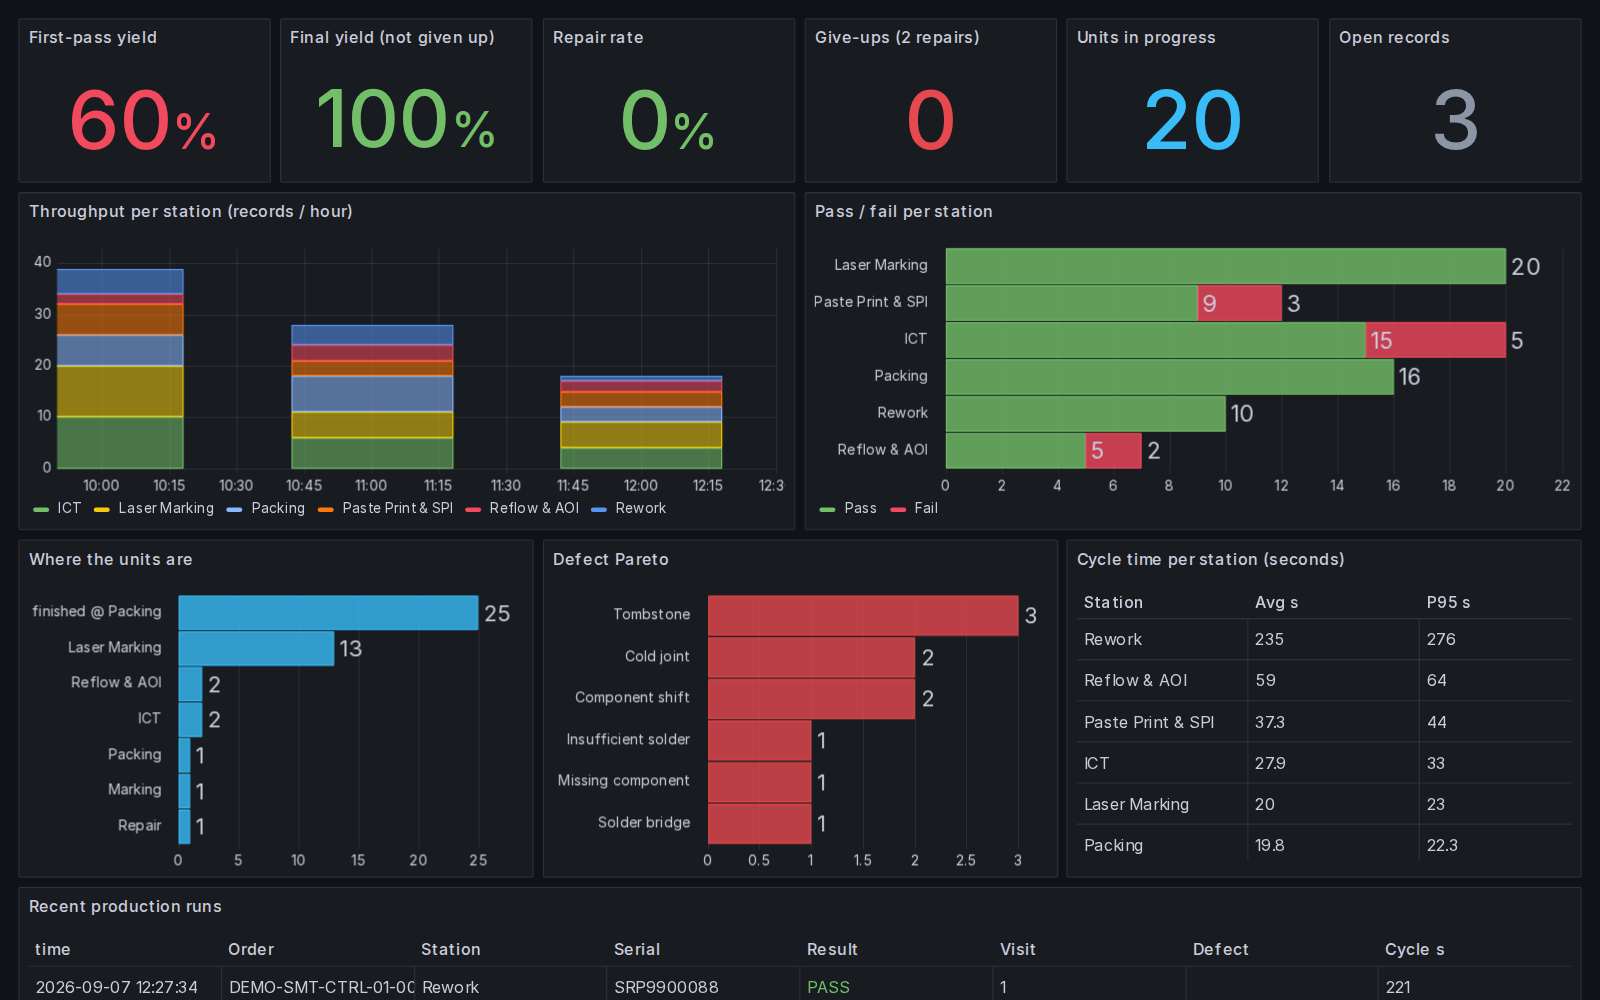
The problem
A weekly report tells you where you were, not where you are: by the time a dip shows up, a thousand more units have shipped.
What Majorbird MES does
A stall or a yield dip is visible now, so supervisors fix it while it still matters, on real numbers straight from the floor.
Why it matters
Yield at a glance
First-pass yield, final yield and repair rate.
Pass/fail and defect Pareto
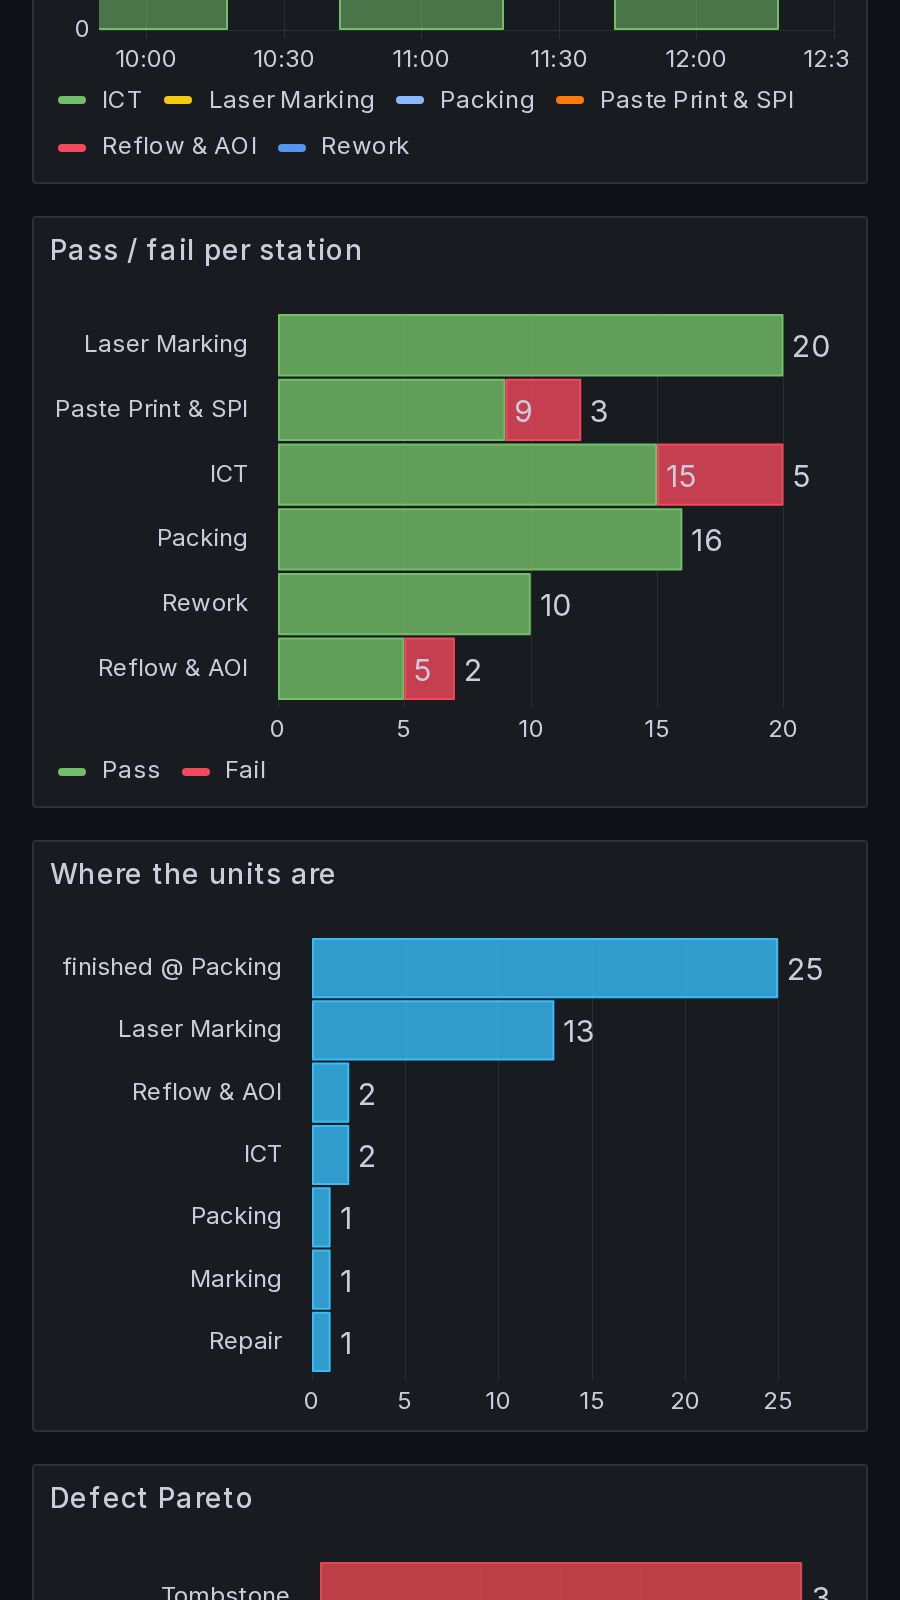
Pass/fail per station and the top failure causes, so the problem check is obvious.
Throughput, WIP and cycle time
Records per hour per station, where every unit is right now, and average and worst-case time per station.
Per order and per unit
An order view and a unit view, filtered by order number or serial, plus a live view of every connected machine.
How it fits
Built on Odoo: it runs inside your Odoo ERP, or as its own instance kept in sync with your ERP. Nothing to rip out.